Growth plan for Shrimp & Grits Kids, 5 Oct 2026
Scale spend. Hold CAC.
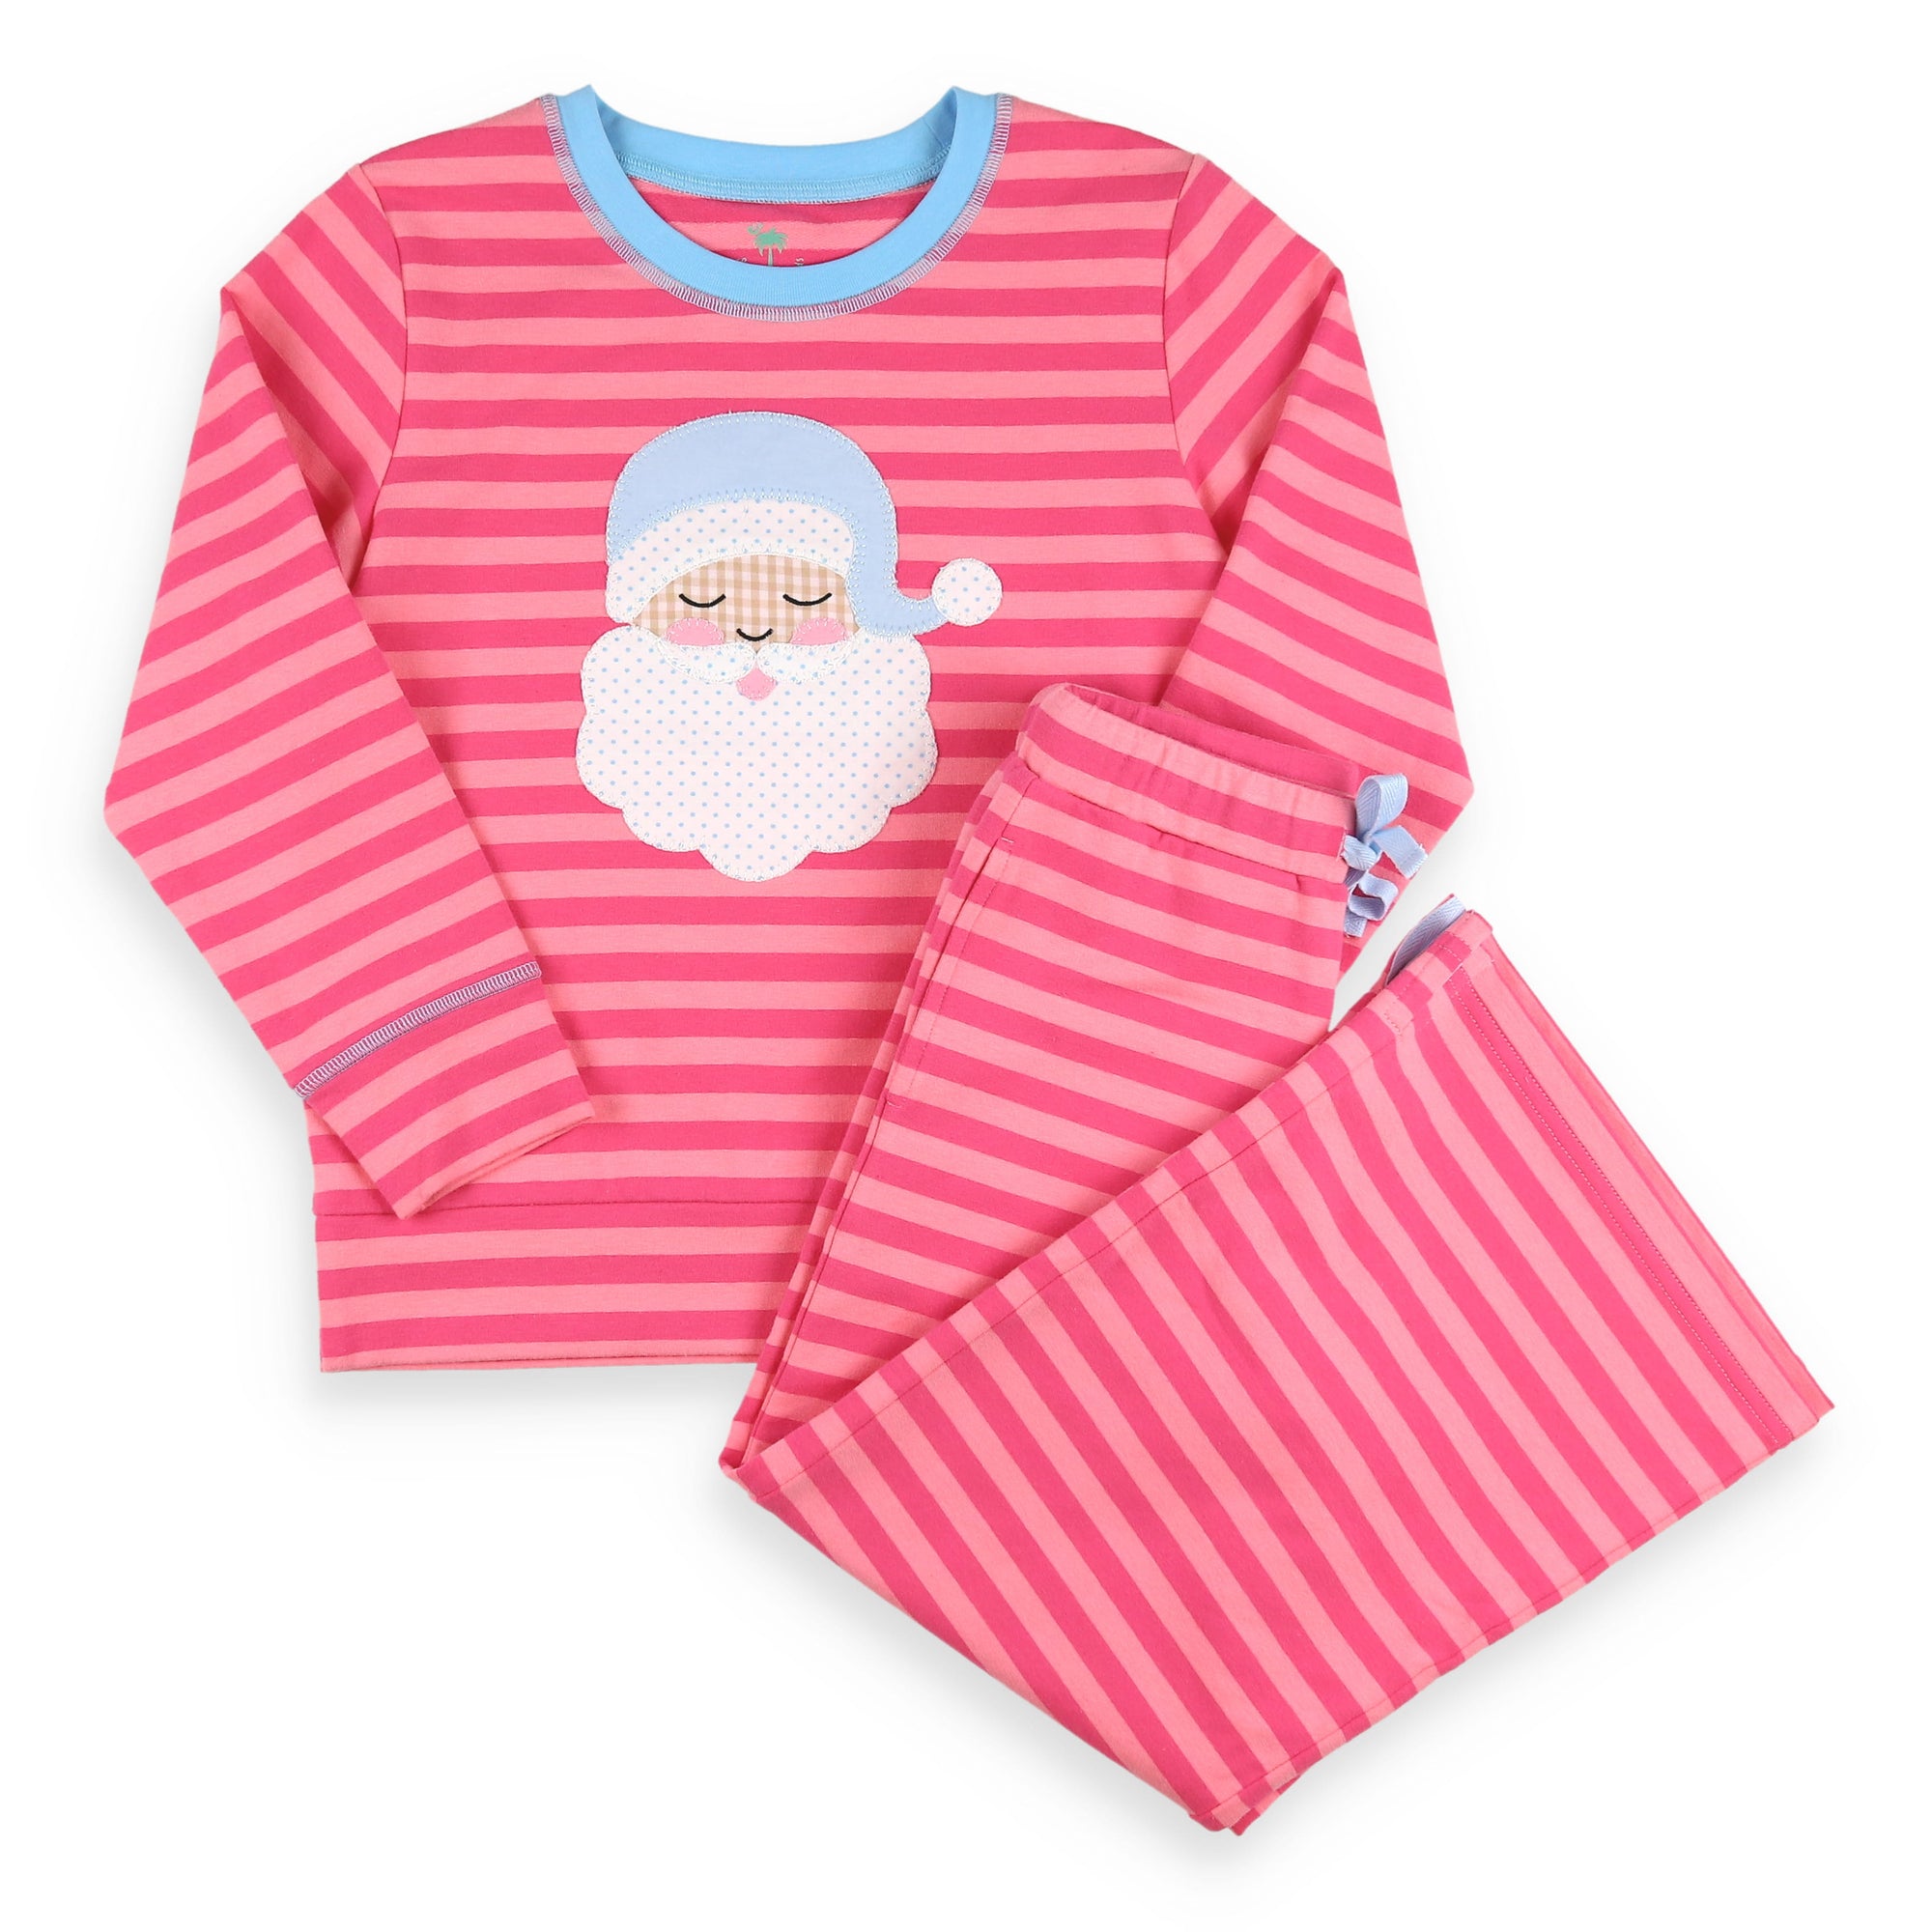
The plan protects one number: a $16.80 target CAC. Behind it sit creator videos, 12 new ads a week to start, and losers killed early, built on 5512 reviews shown on your page and a $35.00 Christmas bamboo loungewear set.
- Target CAC
- $16.80
- New ads a week at peak
- 20
- Creators live by week six
- 10
- Test spend, six weeks
- $24,000
Contents
10 chapters, then the gates and every number’s source.
01 The number
One number to protect: a $16.80 CAC on a $35 order
The one number is a target CAC of $16.80. It comes from a $35 average order, a 40% margin and one repeat order, which gives a $28.00 ceiling. I hold the guard line at 0.6 of that. The inputs are guesses until your numbers replace them.
Protect
Target CAC: $16.80 on a first purchase
Ceiling = average order × margin × (1 + repeat orders): $35 × 40% × (1 + 1) = $28.00. Guard line = 0.6 × $28.00 = $16.80. Across the ranges: $7.14 to $66.15.
Three moves
- Kill losing ads early so spend moves to the few that clear $16.80.
- Log every creator hook in a hook library, one variable per test.
- Pull spend back the day blended CAC crosses the $28.00 ceiling.
- reviews shown on the page
- 5512
- Published
- free-shipping threshold on orders
- $150+
- Published
- cash commission for Associate Sales Reps
- 10%–18%
- Published
02 Variety
Every ad carries one product, one price, one reason to buy
Each concept has to carry one product, one price and one reason to buy: the Boys Pocket Romper - Mallards at $22.00 against $44.00, a Santa Smocked Dress at $45.00, a matching sibling set. Creators supply the proof, and I change one variable per test.
| Reason to buy | Proof you already have | Ads (proposed) |
|---|---|---|
| Matching sibling outfits | classic children's clothing for girls and boys, matching sibling outfits, holiday styles and more | 6 |
| Christmas photo outfits | festive styles made for Christmas mornings, holiday gatherings, family photos | 4 |
| Free shipping | Free Shipping $150+ | 3 |
| Fall sale | UP TO 50% OFF PUMPKINS & FALL FAVES | 2 |
| Review count | 5512 reviews | 1 |
| First-order discount | sign up for our newsletter and SMS marketing to receive 10% off your first purchase | 1 |
| Shop in person in Charleston | if you're in Charleston, you can shop in person at our Mt. Pleasant store. | 1 |
| Total | The ad concepts tab | 18 |
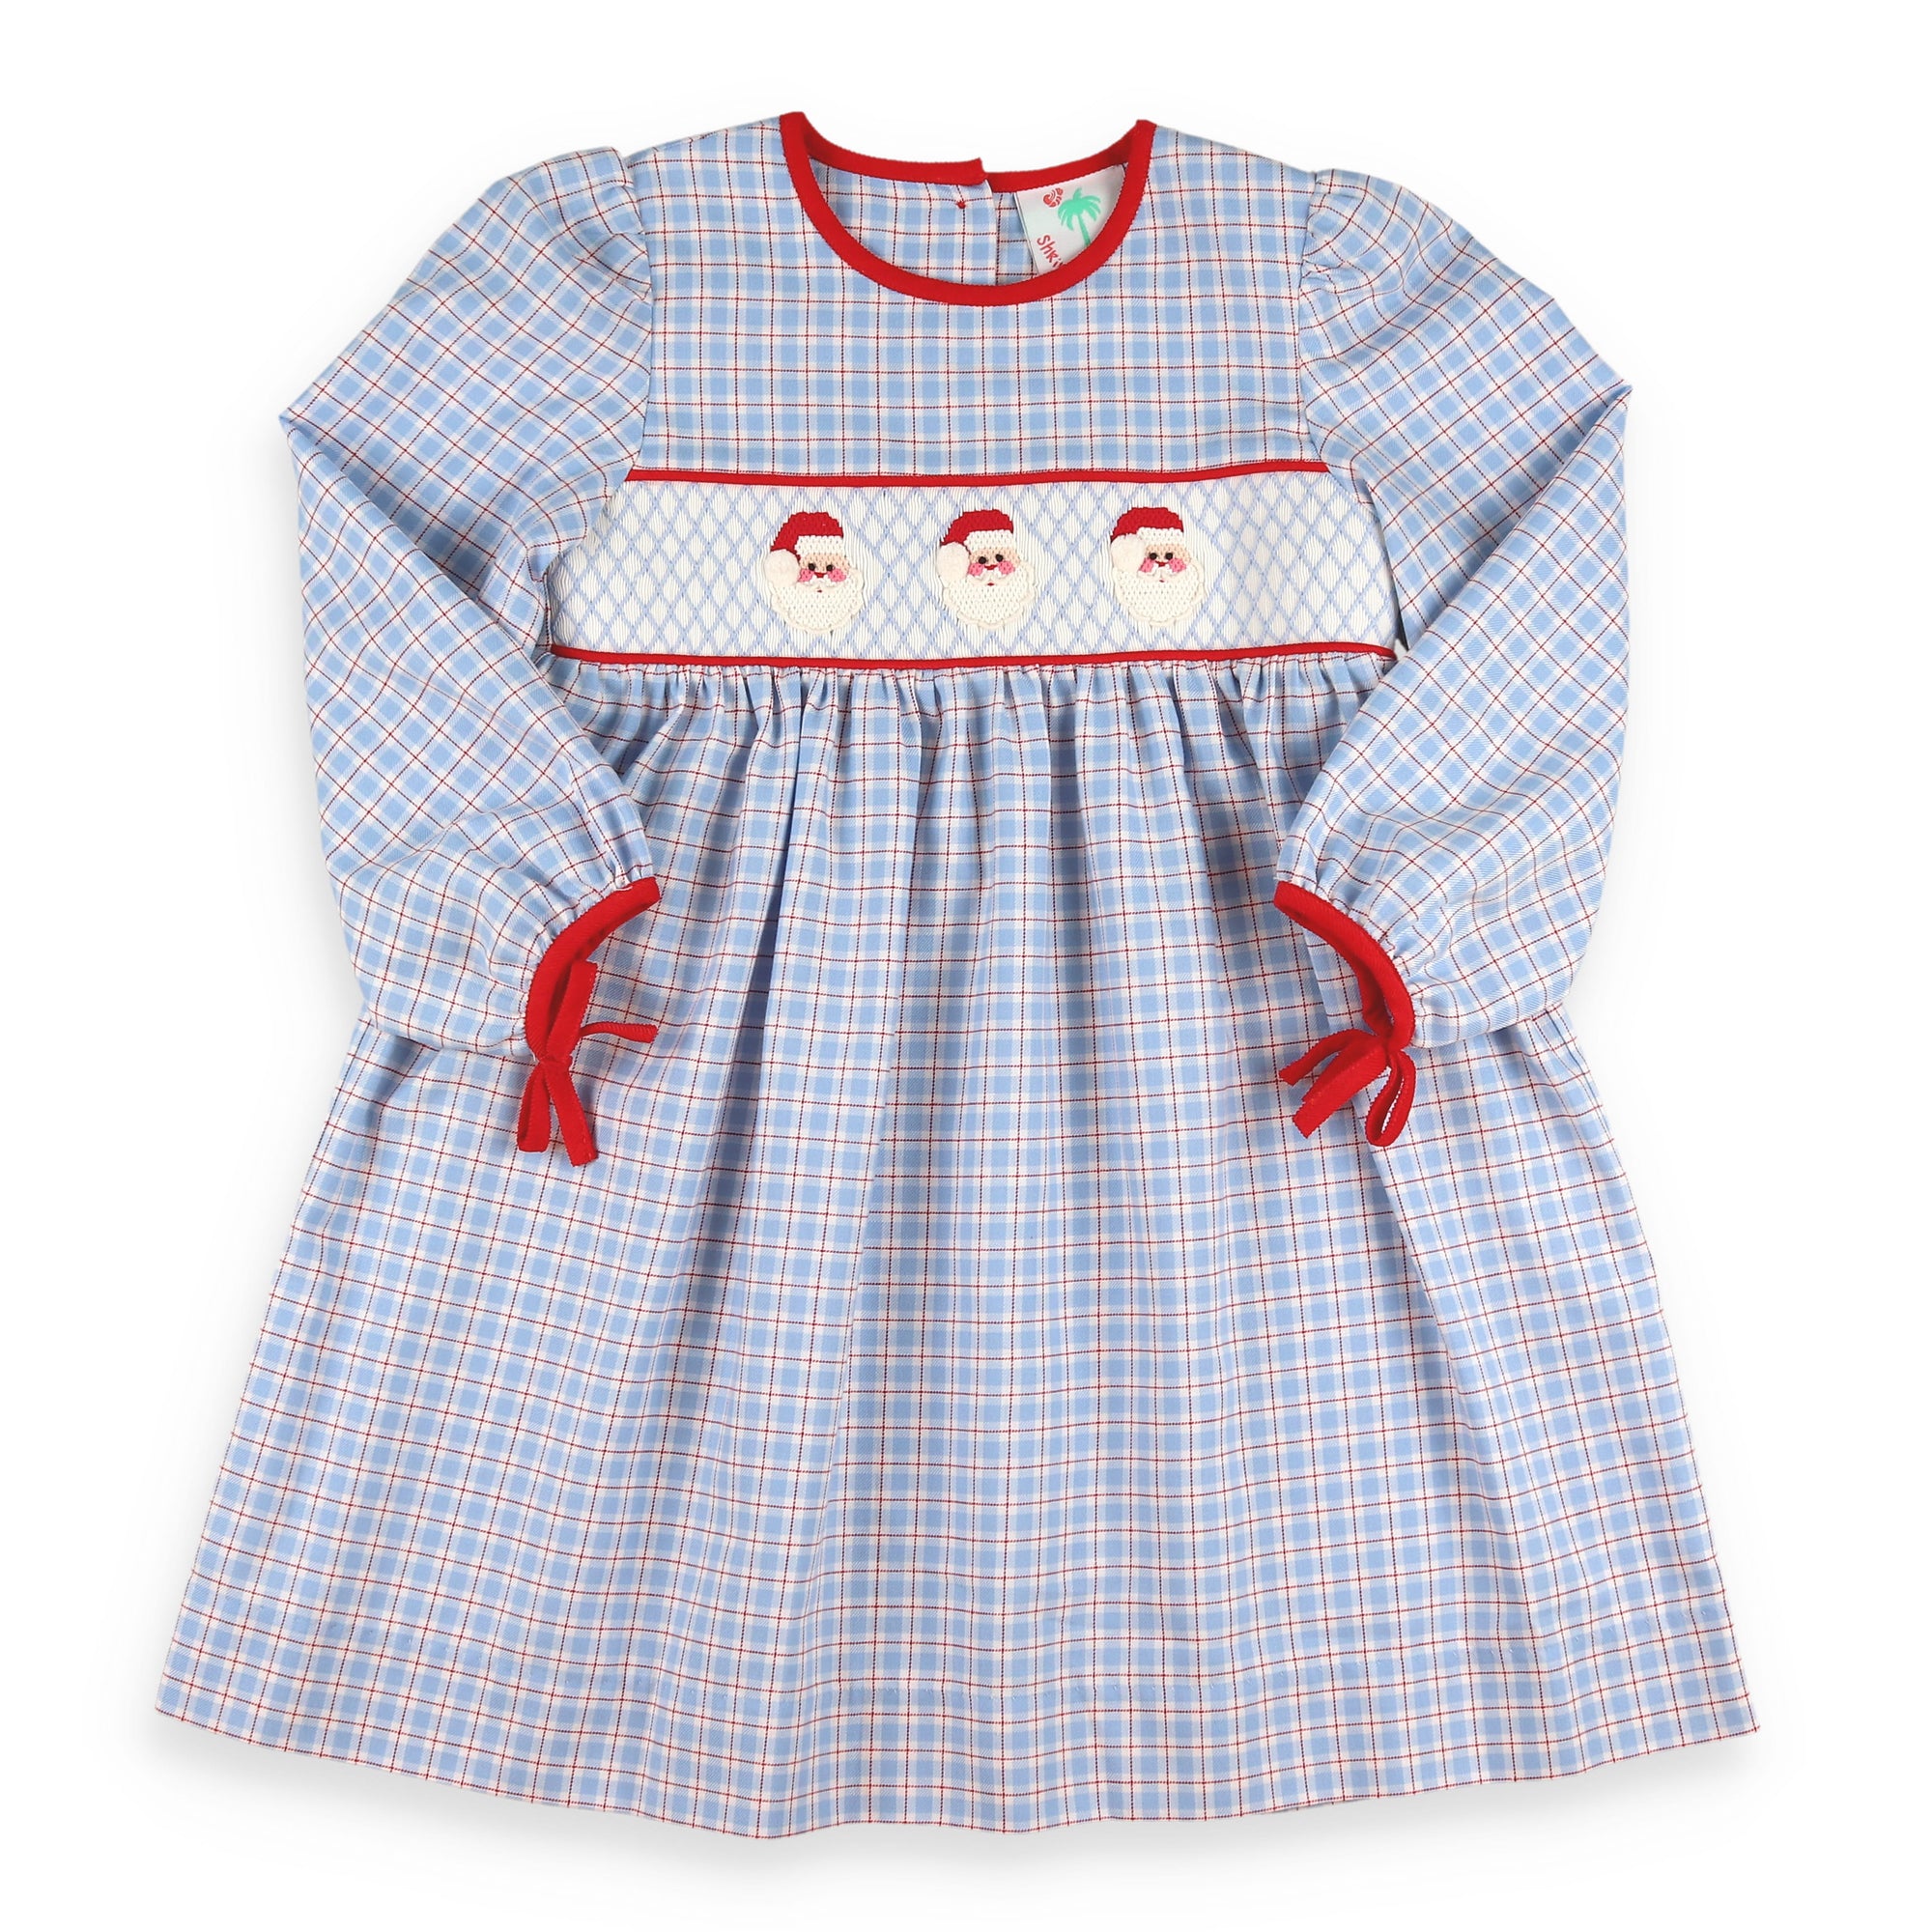
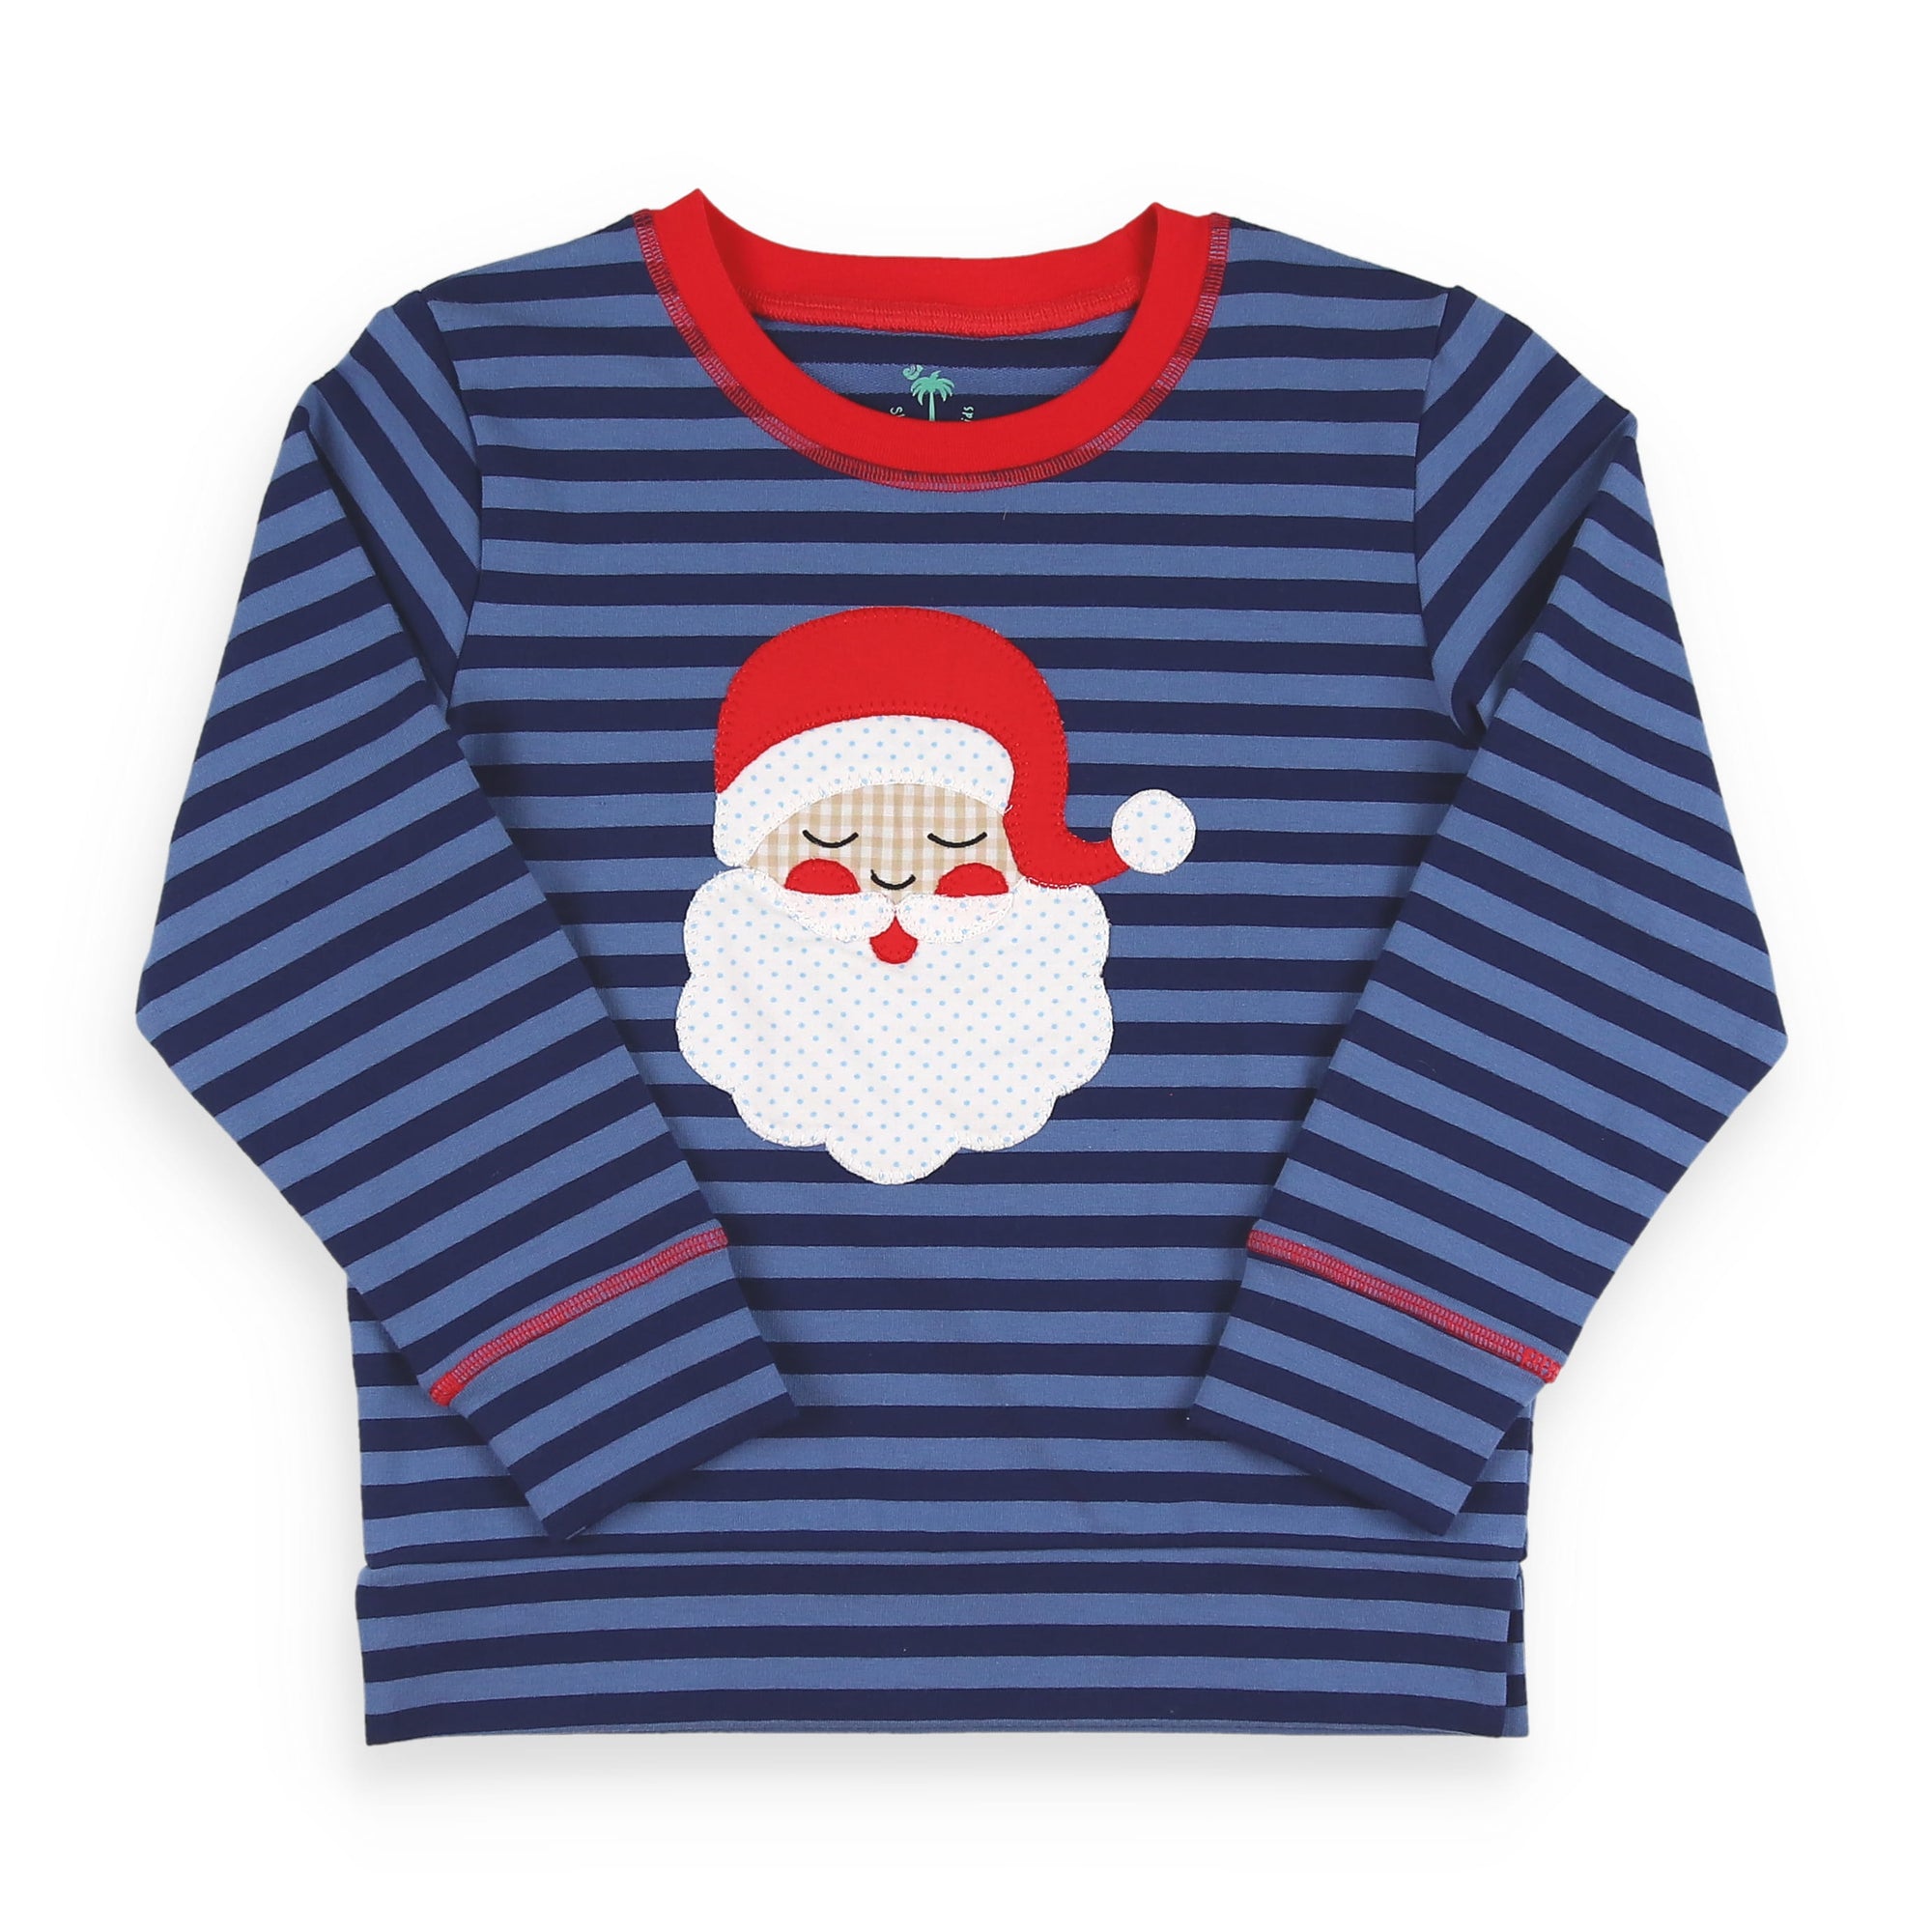
Each row is a reason to buy that the brand already has proof for. The count is how many of the ads carry it: a reason with a single ad is a bet, not a pattern, and the next batch of concepts moves toward the reasons that win.
03 Disturbances
Seven risks, from sale-price confusion to the $150 shipping line
| Disturbance | Likelihood | Impact | Owner | Gate (proposed) |
|---|---|---|---|---|
| Free shipping starts at $150, far above a $35.00 bamboo set, so single-piece orders push CAC up | High | High | Both | Pause single-piece ads if CAC holds above $28.00 through week one's $3,000 |
| Markdowns like $22.00 struck from $44.00 and up to 50% off may attract buyers who never return | Med | High | Me | Keep markdown ads only if CAC stays under $16.80 and repeat orders show up in cohorts |
| Purchase events are not clean, so CAC cannot be read from the first dollar | Med | High | Your team | No ad spend until purchase events match order counts in your store |
| Fewer creators go live than the ramp assumes, so videos and new ads fall behind | Med | Med | Me | If fewer than 10 creators are live by week six, hold test spend at the week-five level |
| Christmas pieces dominate the catalog, so hooks go stale once the holiday window closes | High | Med | Both | Shift hooks to Gameday and fall pieces when Christmas CAC passes $28.00 |
| Mt. Pleasant store sales and online orders blur attribution, hiding the true CAC | Low | Med | Your team | Report store-linked and online CAC separately every week until both read cleanly |
| Hit rate runs below my guess, so winners arrive slower than the volume table shows | Med | Med | Me | If week three shows no winner, cut concepts per week before raising spend |
Scores are my read from outside the company, re-scored in week one with your data. Each risk has one owner and one gate that can be checked with a number, so nobody has to argue about whether it happened.
04 The ceiling
The ceiling is $28.00 and the guard line is $16.80
| Line | Value | Status |
|---|---|---|
| Average order | $35 (range $13.60–$49.00) | Assumption Range from the site product prices (Published); the midpoint is a guess |
| Gross margin | 40% (range 35–45%) | Assumption Replace in week one |
| Repeat orders after the first | 1 (range 0.5–2) | Assumption Replace with cohort data in week one |
| Margin per customer, all orders | $28.00 | Calculated Average order × margin × (1 + repeat orders) |
| Guard line for CAC | $16.80 | Calculated 0.6 × the margin per customer |
The math, with the assumed lines
Ceiling = average order × margin × (1 + repeat orders): $35 × 40% × (1 + 1) = $28.00. Guard line = 0.6 × $28.00 = $16.80. Across the ranges: $7.14 to $66.15.
Range across the assumptions: $7 to $66.
The $28.00 ceiling uses a $35 order, 40% margin and one repeat order: all guesses. The $16.80 guard line is 0.6 of it. Week one replaces each guess with your real order value, margin and repeat orders.
The ceiling is a range, not one number: the most a new customer can cost before shipping and packaging, which I do not have. Replace the guessed lines with yours and every figure below recalculates.
05 Test ramp
Six weeks, $24,000 of tests, 12 ads at $250 each to start
| Week | New ads × budget / ad (proposed) | Weekly test spend | Cumulative | Creators posting | CAC target (proposed) |
|---|---|---|---|---|---|
| 1 | 12 × $250 | $3,000 | $3,000 | 0 | $17 |
| 2 | 12 × $250 | $3,000 | $6,000 | 2 | $17 |
| 3 | 12–20 × $250 | $4,000 | $10,000 | 4 | $17 |
| 4 | 12–20 × $250 | $4,000 | $14,000 | 6 | $17 |
| 5 | 20 × $250 | $5,000 | $19,000 | 8 | $17 |
| 6 | 20 × $250 | $5,000 | $24,000 | 10 | $17 |
Week 1 and week 2 run 12 ads at $250 each, $3,000 a week, so $6,000 in. Weeks 3 and 4 run 12–20 ads for $4,000 each, then weeks 5 and 6 run 20 ads for $5,000 each. Total $24,000 of tests. Proposed.
The math. Week 1: 12 × $250 = $3,000; Week 2: 12 × $250 = $3,000; Week 3: 16 × $250 = $4,000; Week 4: 16 × $250 = $4,000; Week 5: 20 × $250 = $5,000; Week 6: 20 × $250 = $5,000. Total $24,000 (96 ads × $250). A range such as 12–20 counts as its midpoint.
Weeks one and two test what the brand already has, rewritten per reason to buy. From week three, creator videos enter paid only after they beat their own account median. A range of new ads counts as its midpoint in the spend column.
06 Volume
20 concepts should find 2 winners; 80 should find 8
At a guessed hit rate, 20 concepts yield 2 winners and $18,000 of added spend; 80 concepts yield 8 winners and $72,000. Hit rate and spend per winner are guesses, so the test weeks replace them with your data.
| Concepts tested / month | Hit rate (assumed) | New winners / month | Spend each winner holds (assumed) | Added spend at target CAC |
|---|---|---|---|---|
| 20 | 10% | 2 | $300 / day | $18,000 / month |
| 40 | 10% | 4 | $300 / day | $36,000 / month |
| 60 | 10% | 6 | $300 / day | $54,000 / month |
| 80 | 10% | 8 | $300 / day | $72,000 / month |
The math. 20 concepts × 10% = 2 winners × $300 × 30 days = $18,000 a month; 40 concepts × 10% = 4 winners × $300 × 30 days = $36,000 a month; 60 concepts × 10% = 6 winners × $300 × 30 days = $54,000 a month; 80 concepts × 10% = 8 winners × $300 × 30 days = $72,000 a month.
The hit rate and the spend each winner holds are placeholders. The first thirty days of tests replace them with real numbers, and the table is recalculated the same day.
07 Allocation
$100,000 to allocate, weighted to Meta tests on holiday pieces
- Meta creative tests on the Christmas and fall lines
- $45,000
- 45%
- Creator pay and seeding of matching sibling sets
- $25,000
- 25%
- Landing pages for matching sibling outfits
- $10,000
- 10%
- Scaling spend behind winners under target CAC
- $20,000
- 20%
Of the $100,000 to allocate (Proposed), the split is mine to defend; the $24,000 of tests sits inside the first line and scaling follows only winners under $16.80.
The math. 45% × $100,000 = $45,000; 25% × $100,000 = $25,000; 10% × $100,000 = $10,000; 20% × $100,000 = $20,000. Sum 100% = $100,000.
This split is a proposal. It moves toward scaling as winners prove out, and toward testing when fatigue shows.
08 Channels
Meta first, with the Mt. Pleasant store and Share & Earn behind it
| Channel | Open when (proposed) | Why wait |
|---|---|---|
| Meta | Day one, once purchase events match orders | Fast feedback for creator video on matching sibling and holiday outfits |
| TikTok | When a Meta winner holds $16.80 for two weeks | Winning creator cuts get a second life; short video suits the Santa Smocked line |
| Email and SMS | Week 1, since sign-up already offers 10% off a first purchase | It feeds the repeat orders that the $28.00 ceiling counts on |
| Share & Earn reps | After creators prove hooks, test the 10%–18% cash commission link | Reps already share personal links; proven content gives them better posts to share |
| Mt. Pleasant store | Only if Charleston local ads clear the same $16.80 target | Local families can shop in person at the Mt. Pleasant store |
A channel opens when its condition is true, not when the calendar says so. Until then the budget stays where the CAC is earned.
09 Payback
At $30 CAC, a $35 order never pays back
Payback is the real constraint. At a $10 CAC a $35 order is repaid on the first order with $18.00 left. At $15 it repays after repeat orders with $13.00 left. At $30 it never does: stop, −$2.00. At $40, stop, −$12.00.
Cumulative margin per customer, order by order, before CAC: $14.00, $28.00.
| CAC (scenario) | First-order margin | Year-one margin | Left after CAC | Payback |
|---|---|---|---|---|
| $10 | $14.00 | $28.00 | $18.00 | First order |
| $15 | $14.00 | $28.00 | $13.00 | After repeat orders |
| $30 | $14.00 | $28.00 | −$2.00 | Never: stop |
| $40 | $14.00 | $28.00 | −$12.00 | Never: stop |
The math. CAC $10: $28.00 − $10 = $18.00 left; pays back: First order; CAC $15: $28.00 − $15 = $13.00 left; pays back: After repeat orders; CAC $30: $28.00 − $30 = −$2.00 left; pays back: Never: stop; CAC $40: $28.00 − $40 = −$12.00 left; pays back: Never: stop.
Read each row left to right: the margin of the first purchase, the margin over the whole horizon, what is left after CAC, and the purchase on which the CAC is earned back. A scenario that never pays back is a stop, not a test.
10 Scope
Scope: Meta ads and creators for the Charleston kids line
Covers
- Meta ad concepts and weekly tests on the Christmas, fall and Gameday lines
- Creator sourcing, briefs and payouts for matching sibling content
- Landing pages for the strongest outfit stories
- Daily CAC, weekly learnings and monthly cohort payback reporting
Doesn’t
- Event tracking build: I spec it, your team implements it
- Product design, pricing and markdown calendars
- Store operations at Mt. Pleasant and shipping rules
- Anything in your ad account I have not been given access to
What this plan covers is what I can change inside the ad account and the creator program. Everything outside it is named on the right so nobody assumes it is handled.
Gates, written before spend, so stopping isn’t a negotiation.
| Day | Keep going if (proposed) | Stop or change if |
|---|---|---|
| Day 14 | Purchase events match orders and at least one concept converts under $28.00 CAC | Tracking still unreliable, or all ads sit above $28.00 CAC |
| Day 30 | Blended CAC at or under $16.80 while spend rises through the six-week ramp | CAC above $28.00 for two straight weeks |
| Day 60 | Winners hold $16.80 as spend grows, and repeat orders show in cohort payback | CAC at $30 or more, where payback never arrives |
| Day 90 | Creators, hook library and winners sustain spend toward the $100,000 budget at target CAC | CAC above $28.00 after cuts to concepts and spend |
Each gate is checked on its day with the numbers in the daily and weekly reports. If the stop condition is true, the spend stops and nothing renews until we talk.
What exists, what’s missing, and the order that’s forced.
| Piece | Exists today | Missing | Forced order |
|---|---|---|---|
| creative | Product photos for the Santa Smocked Dress at $45.00 | A hook library and tested ad concepts | 1st |
| creators | Share & Earn page with 10%–18% cash commission | A paid creator roster and briefs | 2nd |
| claims sheet | Care note: 95% Cotton/5% Elastane, machine wash cold | A sheet of what ads may say about fabric and fit | 2nd |
| landing pages | Home description names matching sibling outfits | One page per ad concept | 2nd |
| reporting | 5512 reviews on the page, no ad data seen | Daily CAC view and clean purchase events | Week 1 |
The order is forced on purpose: creative and creators come first because they are what moves CAC, and everything else waits for that data.
Every number, and where it came from.
| Figure | Where it came from | Type |
|---|---|---|
| 5512 reviews shown on the page | https://shrimpandgritskids.com/ | Fact |
| $150+ free-shipping threshold on orders | https://shrimpandgritskids.com/ | Fact |
| 10%–18% cash commission for Associate Sales Reps | https://shrimpandgritskids.com/pages/join-the-team | Fact |
| Product prices $13.60–$49.00 | product prices in the site product data (160 products), read 2026-10-05 | Fact |
| $35 average order · 40% margin · 1 repeat order | Placeholders, replaced in week one | Assumed |
| $16.80 target CAC | 0.6 of the $28.00 margin per customer | Calculated |
| $28.00 margin per customer | Price × (margin − discount), summed over the orders | Calculated |
| $24,000 of tests (96 ads × $250) | Danilo’s plan, matches Month one | Calculated |
| 0→10 creators in 6 weeks · 7 videos per creator a week | Danilo’s plan, matches Month one and the Creator engine | Proposed |
| $100,000 first budget split 45% / 25% / 10% / 20% | Danilo’s plan, re-set with the team in week one | Calculated |
| 10% hit rate · $300 a day per winner | Placeholders, replaced by the first 30 days of tests | Assumed |
| 303 creator videos a month at 10 creators | 10 creators × 7 videos a week × 52 ÷ 12 | Calculated |
| $5.74 per 1,000 views against a $1 target | Creator cost over the views the assumptions give | Calculated |
| $1,000 base pay · $50 bonus past 100,000 views | Danilo’s plan | Proposed |
| 1,500 median views · 4% breakout (10×) · 0.5% viral (750,000) | Placeholders, replaced by the first month of posts | Assumed |
| Pay bands $300–$600, $500–$1,000, $800–$1,500 | Danilo’s plan | Proposed |
Every figure on this page is listed here with where it came from. Fact means read on the site. Assumed and Proposed are Danilo’s own numbers, to be replaced in week one. Calculated is plain arithmetic on those, with the formula shown next to it.
Month one is where it starts.
Week one: I ask for ad account access and your real average order and margin, and sit down with your team on purchase events. Then 12 ads at $250 each go live on Meta, built from the Santa Smocked and Christmas Tree lines, one variable per test.